Summary
Oil prices soared this past week, driven largely by great news coming from the EIA.
Although not every indicator (think production) was bullish, the drop in inventories was impressive and shows signs of potential capitulation.
Add to this the drop in the Baker Hughes rig count and investors should remain more bullish than bearish moving forward.
Oil prices soared this week, climbing around 9%, largely driven by great newscoming from the EIA (Energy Information Administration) concerning inventory levels for the prior week’s period. Although the near-term view for crude still appears somewhat negative, this is a refreshing release that helps to alleviate the issues reported a week earlier, which saw inventories soar significantly. In what follows, I will dig into the data and show that, while investors should expect volatility in the weeks to come, this is long-term bullish for those invested in energy companies like Linn Energy (LINE)/LinnCo (LNCO) , Breitburn Energy Partners (BBEP), and Approach Resources (AREX), as well as for those invested in the United States Oil ETF (USO).
Inventories fell a lot
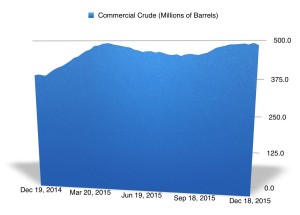
The big takeaway from the week is that oil inventories plummeted by 5.88 million barrels, dropping from 490.7 million barrels (just 0.2 million barrels shy of their all-time high) to 484.8 million. This implies that about 4.5% of the total domestic oil glut vanished over the course of the week, driven mostly by a 7.29 million barrel decline in aggregate net imports versus a week earlier. To put this in context, analysts expected inventories to actually rise by around 1.4 million barrels and the API (American Petroleum Institute) expected inventories to pull back to the tune of 3.6 million barrels. In essence, the EIA’s release handily outperformed both sets of expectations.
(click to enlarge)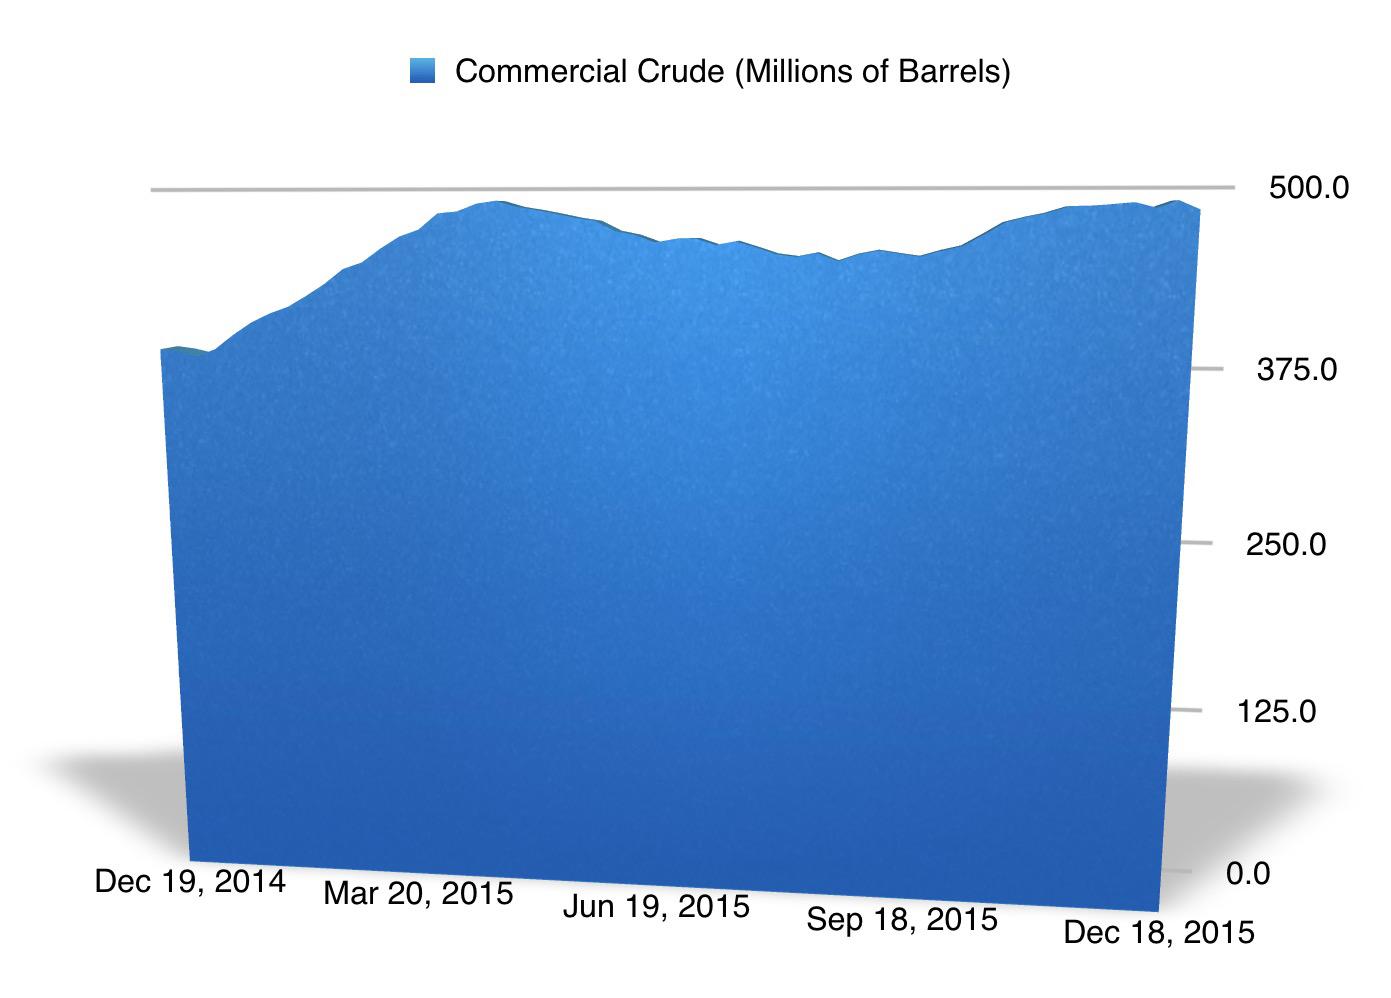
In addition to reporting decreases in crude, the EIA also saw other categories of petroleum products report inventory drawdowns. Based on the data provided, propane/propylene reported the largest drop, with inventories falling 1.4 million barrels. Distillate fuel oil saw inventories decline by 0.7 million barrels for the period, while the “other” category of petroleum products experienced a 0.4 million barrel drawdown. Unfortunately, not every category experienced a drop, the most significant of which was motor gasoline, which saw inventories rise by 1.1 million barrels from 219.4 million to 220.5 million. In spite of this, however, total crude plus petroleum products saw inventories decline by 5.3 million barrels for the week, falling from 1.3106 billion barrels to 1.3053 billion.
Production and demand were a bit of a letdown
There’s no denying that the inventory picture for the week could hardly be better than it was. What was somewhat disappointing, though, was the data covering domestic production and demand. According to the EIA, domestic crude production hit 9.179 million barrels per day for the week. Although this is virtually unchanged from the 9.176 million barrels per day seen a week ago, it would be nice to see a sustained downturn in production. At some point in time, the large drop in the U.S. oil rig count should have a negative impact on output beyond the 431,000 thousand barrel per day drop seen since production peaked earlier this year, but the timing of the drop is uncertain.
(click to enlarge)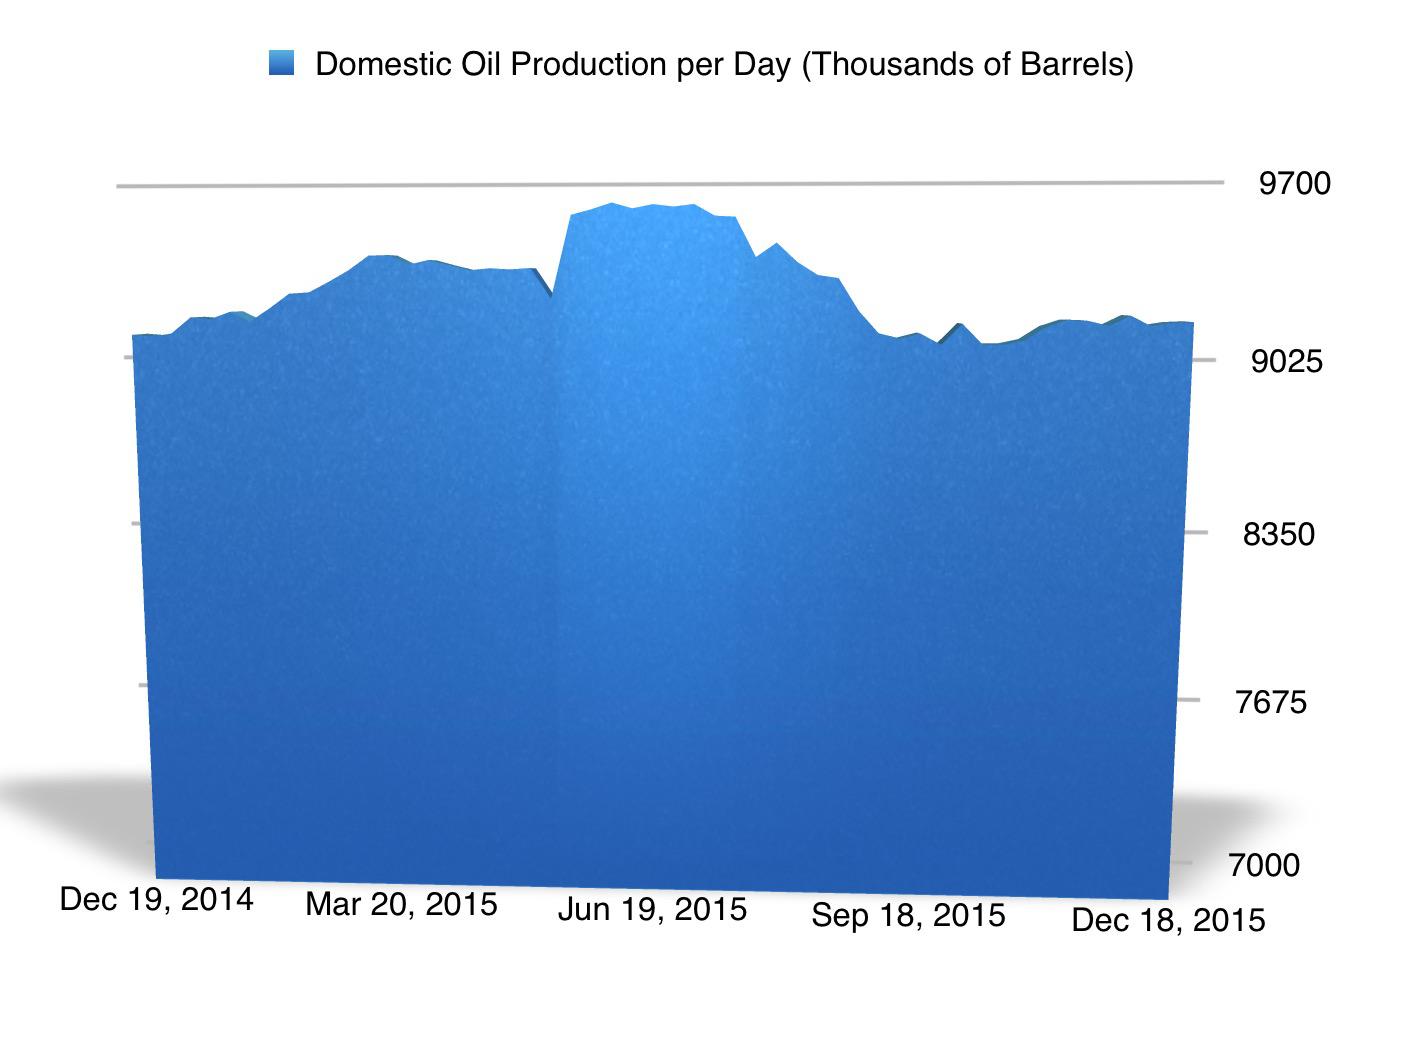
Another lackluster piece of data reported by the organization relates to the demand for motor gasoline, a major indicator of the country’s appetite for crude. According to the EIA, motor gasoline consumption for the week totaled 9.185 million barrels per day. This is lower than the 9.220 million barrels per day seen a week prior and is significantly lower than the 9.518 million barrels per day consumed the same period a year ago. At first glance, this may point to tough times ahead for this market but the demand for motor gasoline is extremely volatile from week-to-week. A more stable indicator would be to look at the year-over-year data on a four-week average basis, which will show that consumption is up about 0.7% from 9.216 million barrels per day to 9.277 million.
Oil rigs are falling… again
Although a useless indicator for short-term oil production, the oil rig count should be a good indicator for the long-term path that production will ultimately take. According to Baker Hughes (BHI), the number of rigs in operation in the U.S. declined by 3 to 538 for the week. This represents a 64.1% drop compared to the 1,499 oil rigs that were in operation the same week a year ago. In Canada, where decline rates are much lower (so rig count matters less), the number of units in operation plummeted by 27 to just 44. This represents a decline of 53.2% from the 94 units that were operating the same week last year.
Takeaway
Right now, the picture facing oil from a pricing standpoint could certainly be better but data from both the EIA and Baker Hughes suggests that the situation is improving again. In addition to seeing inventories decline by a nice chunk, the rig count is also falling. Unfortunately, production is still stubborn for now and demand for products like motor gasoline could certainly be higher but, overall, the data reported for the week is certainly more bullish than it is bearish.