It was noted that we could continue to see CapEx cuts that go above the 24% cut in 2016. The topic of conversation is going from Boom to Bust and where their future sits with continued oversupply. Many comparisons are being made to 1986-87, the most recent example of multiple year spending cuts when prices dropped by ~66% due to a flooded market. That fact that more cuts are likely ahead as per Exxon Mobil Corp. help communicates that these companies do not see a bottom in price yet.
US Oil Has met Multiple Indicator Resistance That Could Be A High Hurdle
for Bulls
Free 2-Minute Oil Market Chart & Top News Update Video
Key Levels from Here
The price level that bulls appear unwilling to buy above is ~$33.50/barrel. Since the first week of January, we have failed multiple times around ~33.50 reaching an intraday price high of $34.79 on January 28, but even then closed around $33.70.
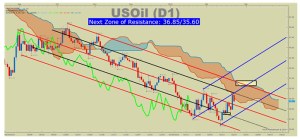
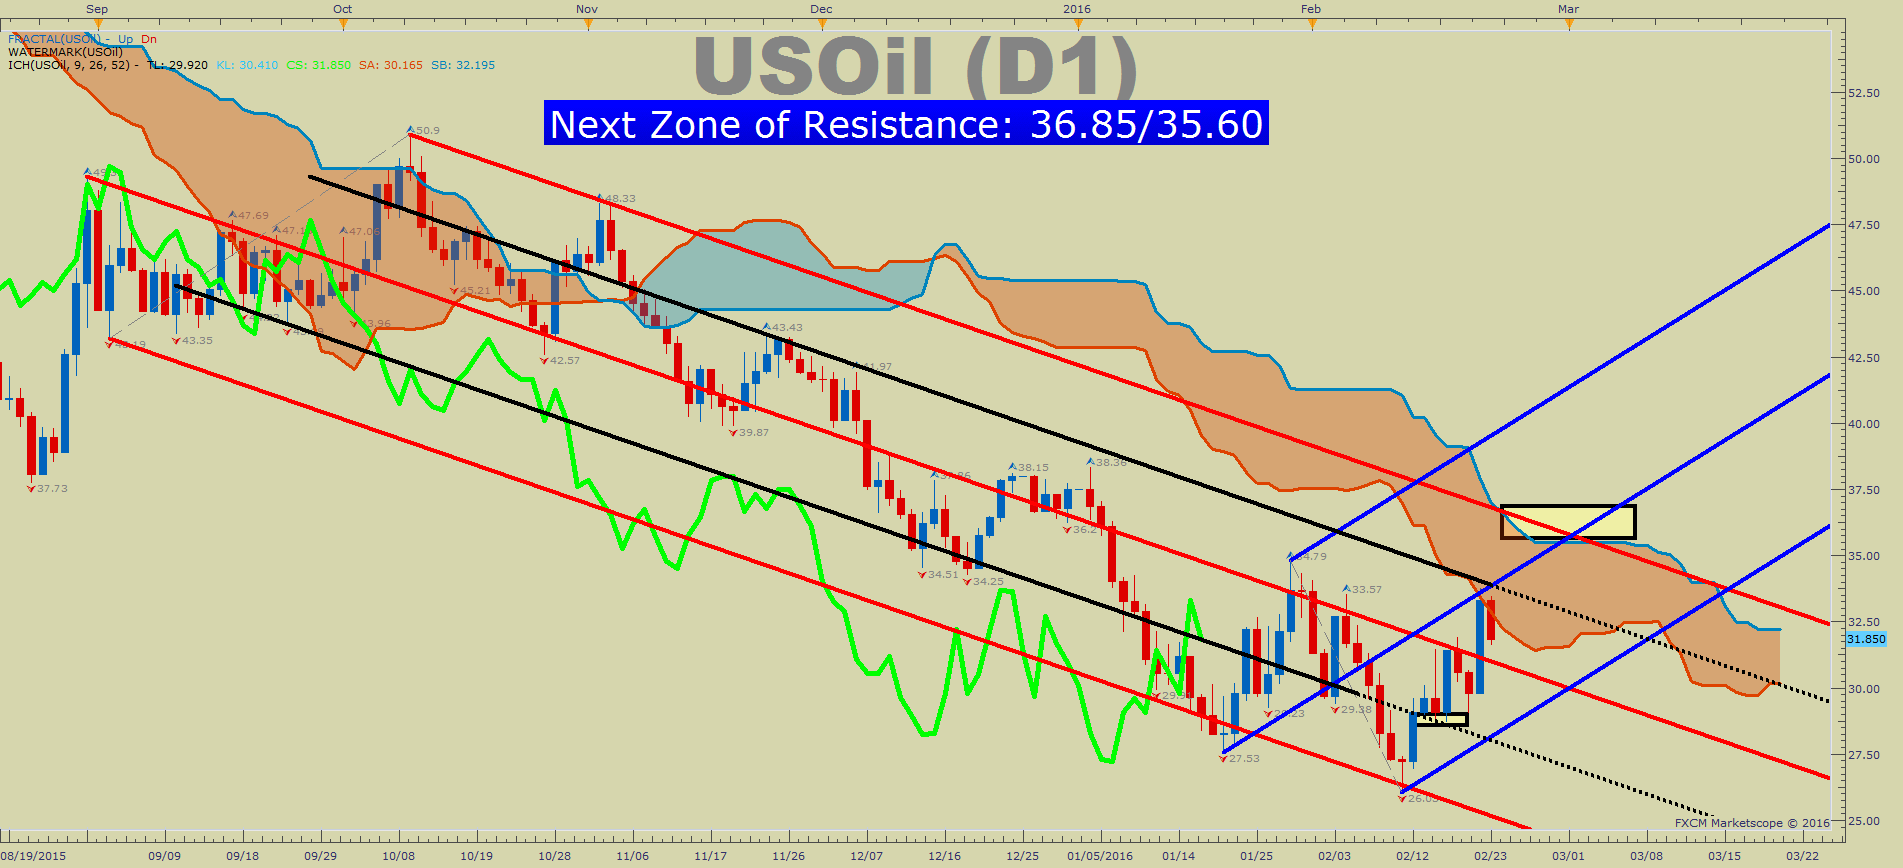
Now, attention turns multiple zones of resistance that could provide much–needed clarity on the charts. In short, an inability to break above the confluence of resistance such as the 55-day moving average, mentioned in today’s video, the Ichimoku Cloud and internal resistance of the price channel would favor either a test of new lows or continued oscillation around $30/bb. However, ability to break above the multiple zones of support such that we could see a test of the 2016 price high of $38.36/bbl would not only bring a YTD high but also show that we’ve managed to break through strong downtrend resistance.
To See How FXCM’s Live Clients Are Positioned In FX & Equities Click Here Now.
While price resistance at ~$33.50 zone catches my eye on the chart, it’s worth noting that momentum has slowed on the downside, and a weaker dollar could make the breakout higher easier to materialize. As noted above, there are still many fundamental hurdles holding the price down, but a speculative push higher could come if trader’s see a breakout and fear of missing out (F.O.M.O.) takes over.
Contrarian System Warns of Further Price Support
In addition to the technical pressure that Oil may have found at trend line resistance, the larger bearish viewaligns with our Speculative Sentiment Index or SSI. Our internal readings of Oil are showing an SSI reading of -1.0669.We use our SSI as a contrarian indicator to price action, and the fact that the majority of tradershave moved from net long to now net short provides a contrarian signal that US Oil may continue eventually higher through resistance.If the reading was to turn positive yet again, and the price broke back above $28.68bbl, we could begin looking for a retest of the YTD low of $26.03.
T.Y.