Summary
Key world oil number.
Decline not “off a cliff.”
Weekly estimates flawed.
Oil shale’s influence on U.S. production sparked a world oil price war. It affects the value of energy sector investments worldwide. It is of keen interest by U.S. and world oil market participants.
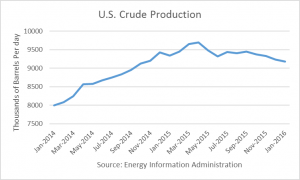
The Energy Information Agency (EIA) reported the much-watched monthly U.S. crude production number today, released four days behind schedule. The January 2016 figure came in at 9.179 million barrels per day, down 56,000 b/d from December.

Based the EIA’s latest revisions, production peaked in April 2015 at just under 9.7 million barrels per day (mmbd). January’s figure is 515,000 b/d lower, a decline average of 57,000 b/d per month.
The decline rate has hardly depicted production “falling off a cliff,” as many have predicted. As an example of such pundits, one wrote in September that production would drop to about 8.5 mmbd by the end of the year (2015).
More recently, Andy Hall, “crude oil trading god,” wrote in his March 2016 letter to investors that “The average for the past four weeks is now 863 kbpd below year ago levels,” which would put production at 8.296 mmbd in February 2016, almost 900,000 b/d below the January number reported above. That analysis appears to be far off-base.
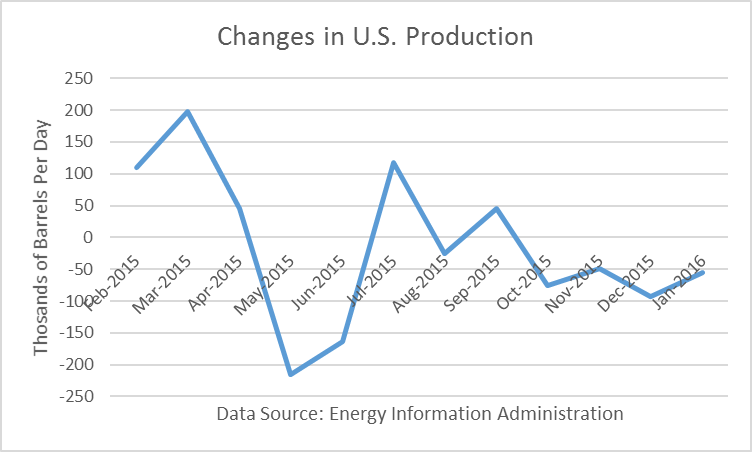
One of many reasons for the slower decline rate was an uptick in Gulf of Mexico production. In July, offshore production rose by almost 150,000 b/d as a project started many years ago came on-line.
The monthly numbers are based on a survey method that the EIA commenced in 2015. Prior to that they were based on data filings from states, some of which lagged up to a year.
EIA’s weekly numbers are based on its model, which I have written is highly flawed. The graph below shows a comparison of how the monthly figures compared to the weekly figures (interpolated) since January 2015.
Estimation Errors
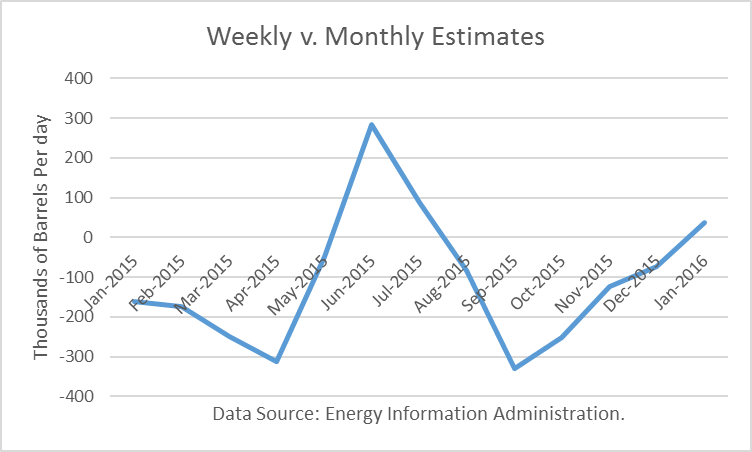
The estimation error (as measured by the standard deviation) is +/- 172,000 b/d. That means that the error weekly numbers reported, as tabulated on a monthly basis, may be more than 172,000 b/d higher or lower than “actual” (as reported by the survey data, which is sometimes revised) about 33% of the time. In other words, do not rely on the weekly estimates as being accurate.
The weeklies had been underestimating the monthlies for much of 2015. In January 2016, the weeklies actually overestimated the monthly figure by a small amount.
Forecast Errors
I compared the EIA’s Short-Term Energy Outlook forecasts for January 2016 each month beginning in January 2015 with the reported actual (which is subject to being revised). The month of the projection is indicated along the X-axis in the graph below.
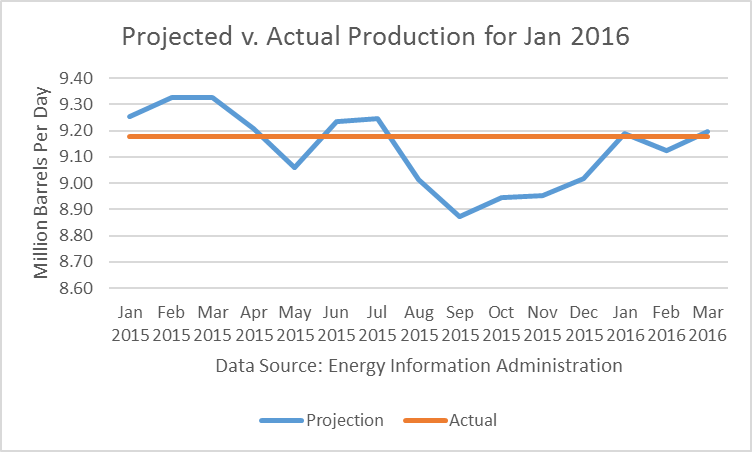
For the first half of 2015, the EIA was overestimating future production. Its model is based on rig counts, and it had no experience forecasting with sharply dropping prices after shale oil had become a large source of U.S. production.
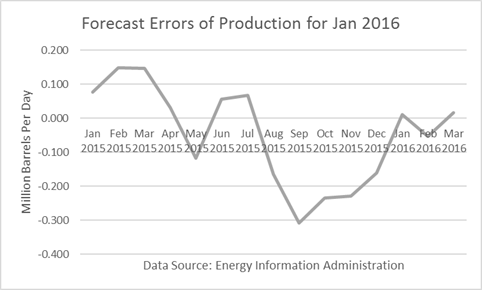
In the latter half of 2015, the EIA lowered its forecasts of future production too quickly. Its September estimate was about 300,000 b/d below the January actual.
Surprisingly, its monthly projections were better than its weekly estimates (interpolated monthly). The forecast error (as measured by the standard deviation) was 145,000 b/d, 27,000 b/d lower than the estimation error. Having more current information was a negative for the EIA. Go figure.
EIA’s Projections for 2016
I wrote an article called, “Do Not Project Future Crude Production From Weekly Trends.” By reviewing EIA’s forecast changes for 2016, it appears they are heavily influenced by their weekly model.
Way back in January 2015, the EIA was projecting 2016 production to average 9.5 mmbd. That was after oil prices cratered following the OPEC meeting in November 2014. The forecasting process seemed to be “blind” to collapsing prices.
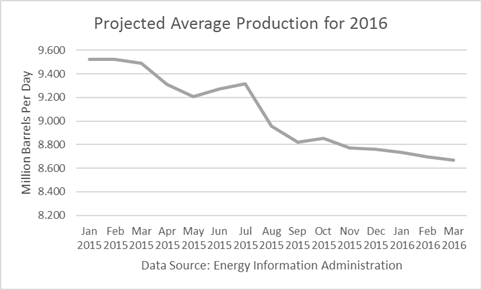
In April and May 2015, the EIA revised down its projections for 2016 by more than 250,000 b/d. Looking at its weekly statistics, it had assessed that crude oil production had peaked the week ending March 20 th. Because its weekly model was saying that oil production had begun to drop, it projected more aggressive drops into the future.
But suddenly, for the week ending May 22nd, EIA revised its estimate up by 304,000 b/d. Its analyst told me that they had received data from the states that oil production was higher than they had thought, so they rolled the two months’ revisions into one week. This caused it to increase its projections for 2016 as shown in the graph for June and July.
By late July, its weekly model was spitting out lower production numbers again. So its August and September forecasts for 2016 were sharply reduced by more than 400,000 b/d.
At the end of August, the EIA had announced that it had changed its monthly data reporting to a survey method. This caused it to revise all of its monthly data for the year. The revisions showed higher production than its previous monthly estimates. So in October, it revised its 2016 projections up a bit.
But its weekly model showed in October that production had fallen a lot. So it kept revising its 2016 projections down modestly each month since then.
Perhaps it was influenced commentators in the media saying that production was just about to fall off a cliff?
Conclusions
EIA’s “best” estimates show a relatively modest decline rate in U.S. production after peaking in April (not March now) of 2015.
EIA’s weekly assessments have mainly underestimated production but not always.
EIA’s longer-term projections appear to be heavily influenced by its weekly model. But their assessments are more reasonable than many commentators claiming to know better.